David A Notes YOUR OFFWORLD INVESTMENTS IN ARTIFICIAL DUMBNESS PAID $? IN DIVIDENDS
Graphs, combinatorial optimization, and product development
Introduction
Software product development can be thought of as spending scarce time, effort, and attention in order to (hopefully) deliver customer value. The actual details of how this happens in practice are rarely as simple as “go build XYZ”, instead messy reality consists of an interconnected web of target users and use cases, deliverables and milestones, noisy estimates, and interlocking dependencies. Teams must navigate questions of prioritization and sequencing in the context of this complexity and uncertainty, and mental models or frameworks can be useful tools to help impose some order onto the chaos. This post describes one possible framing inspired by a well-known combinatorial optimization problem over graphs, Prize Collecting Steiner Trees (PCST).
Minimum viable product
Say your team is building a simple analytics service to help email marketers better understand the performance of their campaigns.
Assuming we understand the target user needs well enough, delivering some bare minimum system for this use case will require implementing a handful of foundational functionalities. For example, perhaps our base system needs:
- instrumentation to determine if emails are opened or links are clicked, sending outcomes to …
- collection machinery for capturing and ingesting this data into a …
- database for persistently storing this information in a form suitable for …
- query interfaces for users to run various analyses.
Feature backlog
The magic of software is that additional potential use cases and features beyond this basic core are limited only by the imaginations of the users, product management (PM), and engineering team. Marketing analysts may also wish to do one or more of:
- join target emails against other customer information (eg, demographics) to slice and dice success rates
- generate pleasant and informative data visualizations
- use those visualizations to create real-time business dashboards
- train predictive machine learning (ML) models to optimize email personalization
- do all of the above from their mobile device.
None of this comes for free. All the additional code has to be designed, written, tested, bugfixed, deployed, and monitored. Weighing these costs against the expected benefits of the resulting features is one of the principal tasks of product development.
Dependency structure
There also exists an underlying dependency structure among these enhancements. Like a strategy game tech tree, it is unlikely that you can successfully ship real-time dashboards before building basic charting, and training ML models will require being able to integrate your click data with other data sources for feature generation. How can we incorporate these constraints into our planning and decision-making?
Put a graph on it
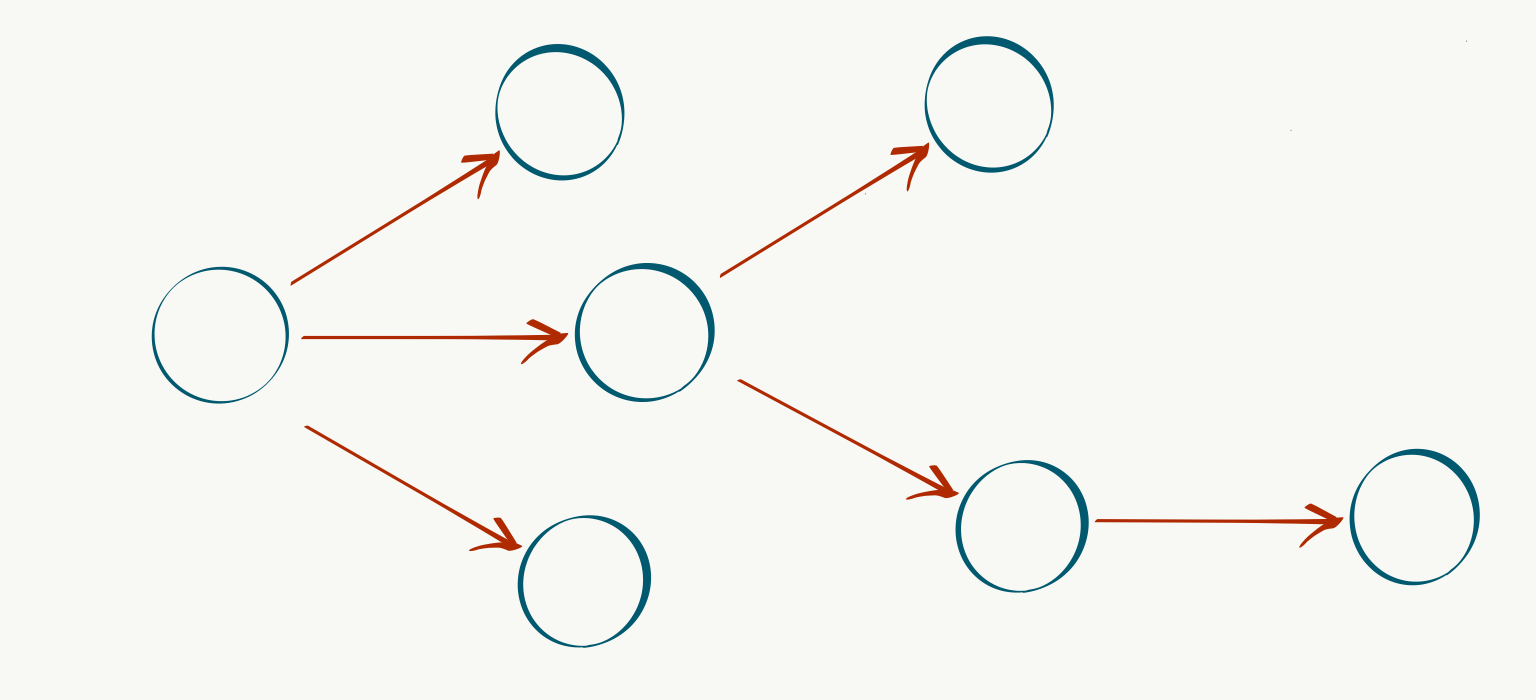
Just as someone with a hammer sees all problems as nails, a Computer Science (CS) background can lead to perceiving all problems as amenable to graph-based approaches, which is exactly what we’ll do here. Let $G=(V,E)$ be a directed acyclic graph (DAG) representing our product roadmap, where vertices (or nodes) $v \in V$ correspond to features or capabilities (such as basic charting) and their incoming edges $e \in E$ correspond to the aforementioned dependency structure. For example, if $v_{b}$ “real-time dashboarding” requires $v_a$ basic charting, we can represent it with a directed edge $(v_a, v_b)$:

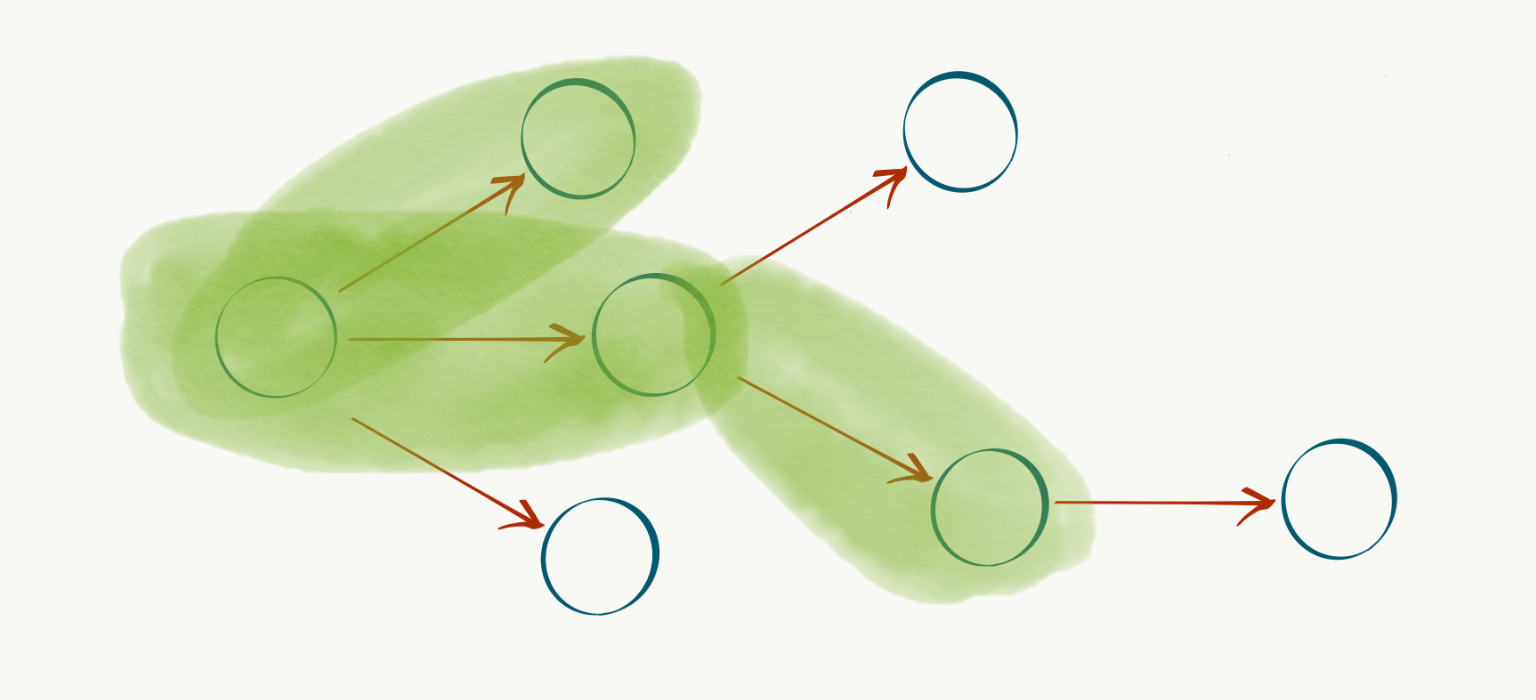
We can then define a special root vertex $r$ to represent the current state of our system, and populate out the rest of the capabilities and dependencies as nodes and edges connected to $r$:
What about the costs and benefits? We can model these with a non-negative cost function over edges $c: E \rightarrow \mathbb{R}^+$ and a similar profit function over nodes $p: V \rightarrow \mathbb{R}^+$. Intuitively, we would like to devise our development plans to achieve maximum benefit for minimum cost. This goal can be translated into the problem of identifying a connected subgraph $T \subset G$ containing $r$ (in fact, $T$ will always be a tree) to maximize the objective function
\[\max_T \sum_{v' \in T_v} p(v') - \sum_{e' \in T_e} c(e')\]where, if $T = (V’, E’)$, then $T_v$ is the set of vertices $V’$ and $T_e$ is the set of edges $E’$.
Each candidate solution $T \subset G$ corresponds to some tree rooted at $r$. In our problem domain, this corresponds to a development plan spending the effort $\sum_{e’ \in T_e} c(e’)$ to achieve the milestones $v’ \in T_v$. Our domain dependency constraints are guaranteed to be met via the graph encoding, the connectivity requirement on $T$, and the inclusion of root $r$.

It turns out that this is an instance of a well-studied problem in theoretical CS known as the Prize-Collecting Steiner Tree (PCST) (nodes are “prizes”). Example applications of this problem are optimizing network layouts in telecommunication infrastructure or sensors in the utility grid. The PCST problem setting is an undirected and rootless graph, whereas the special case shown here with directed edges and a defined root $r$ is an instance of a rooted Steiner arborescence.
Implications for product development
The utility of a simplified model like this can be evaluated in terms of helping us to reason about real-life situations and manage the effective allocation of scarce resources. We can examine some some typical failure modes and advice through this lens. In each of these scenarios we show simplified schematic payoff charts of total cost (effort expended) on the x-axis versus profit (value delivered) on the y-axis.
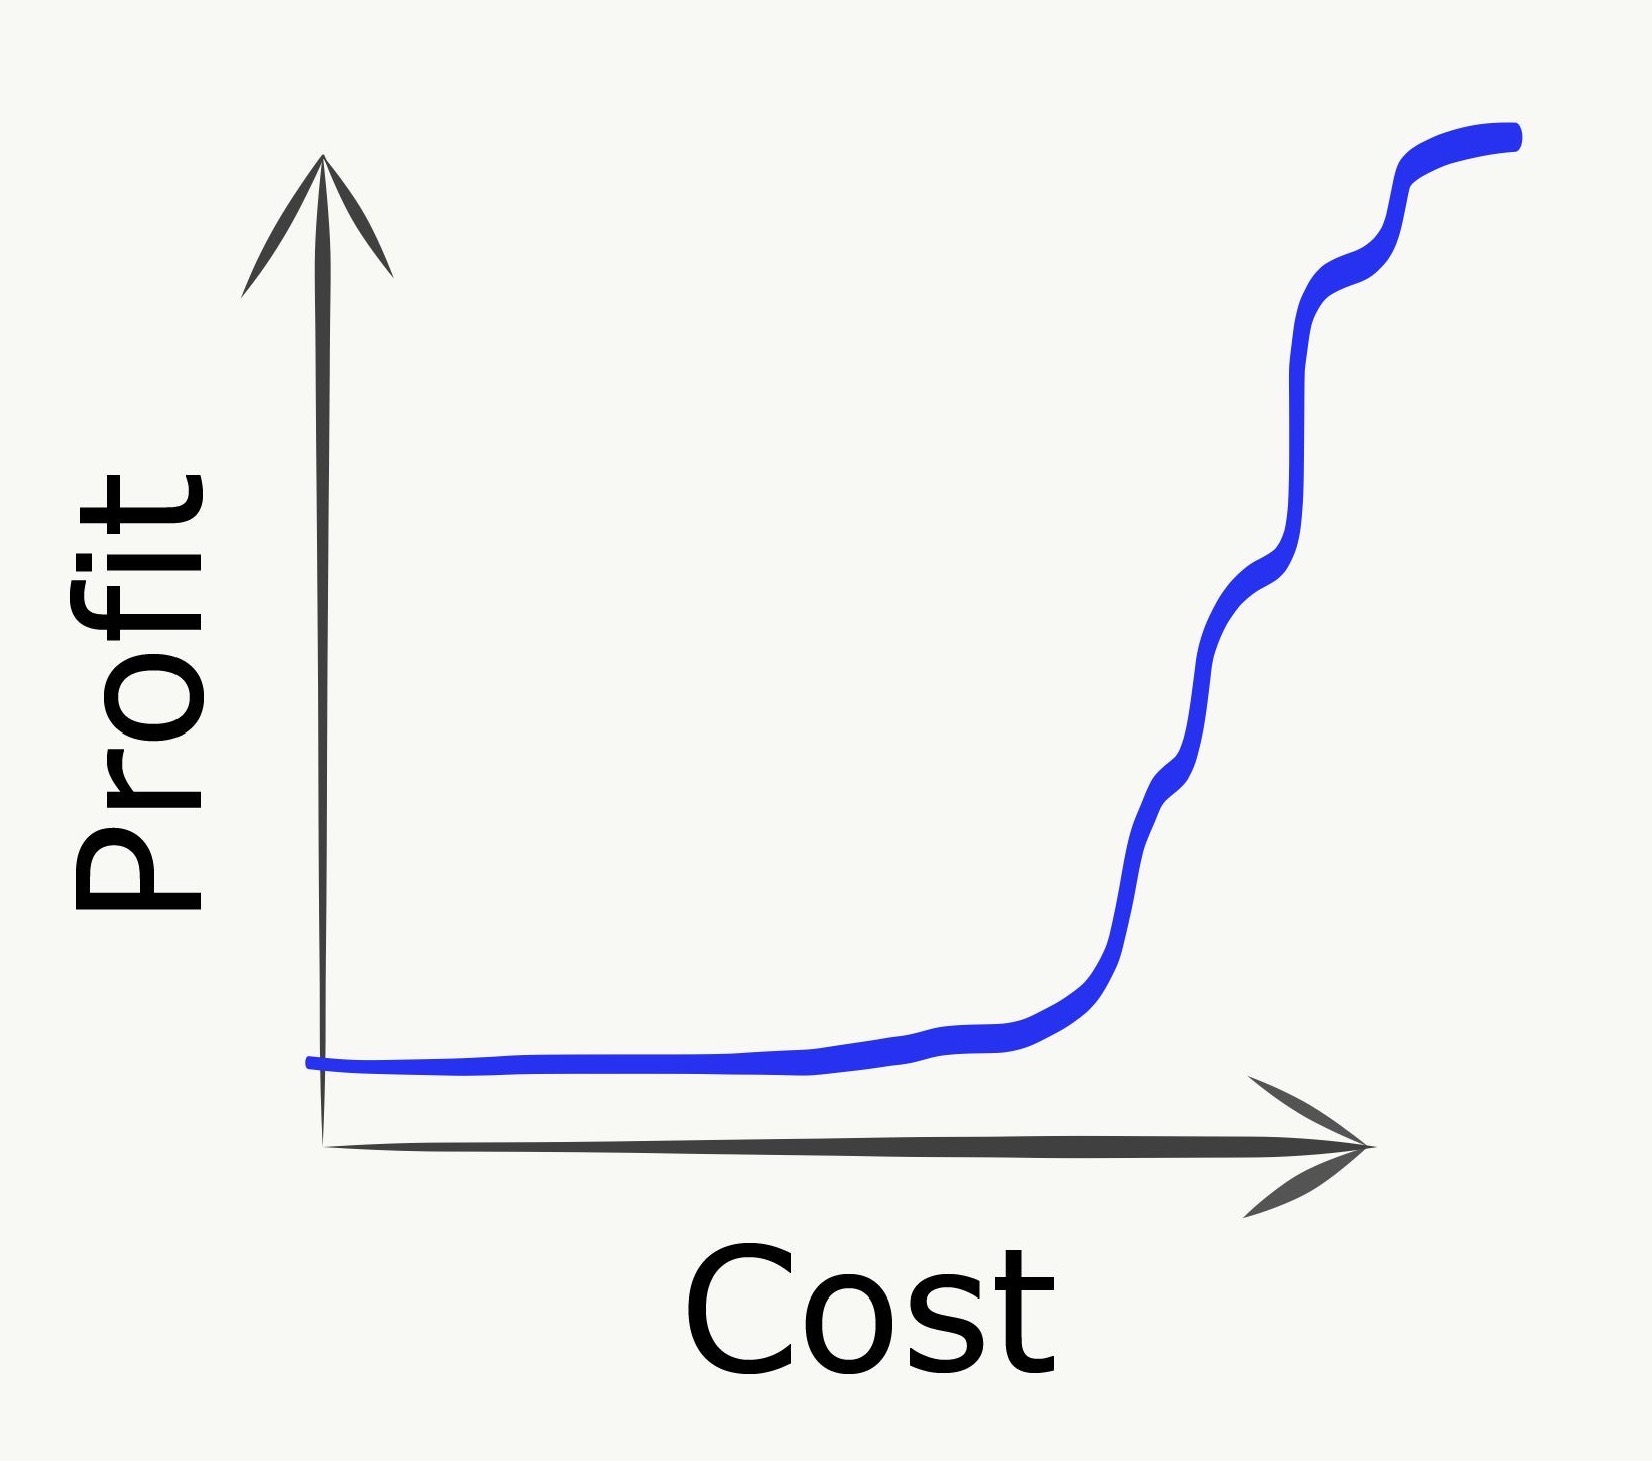
Peanut-buttering / breadth-first
“Peanut-buttering” refers to spreading efforts too thinly across too many goals. Consider a relaxation of the PCST problem where you can partially buy edges, but only gain the profit when an edge is fully purchased. In a peanut-buttering strategy, we allocate our spend across many edges, corresponding to highly parallelizing work streams across as many tasks as possible. The downside is that no value is delivered whatsoever until tasks start crossing the finish line, as shown in the payoff chart:
In practice this strategy can be even worse than it looks here, due to uncertainty effects that will be mentioned below.
Over-specialization / depth-first
Going to another extreme, we can imagine pursuing some single longest path as deeply as possible. This could correspond to building out some very specific niche use case to the exclusion of any even basic complementary capabilities.
In this scenario, we can initially make good progress but eventually plateau into diminishing returns by continuing to invest in further incremental improvements along this deep dependency path. Returning to our marketing analytics example, this could be a development plan where we continue to deliver increasingly sophisticated and esoteric advanced ML capabilities without ever investing in even basic visualization, reporting, or data import/export functionalities.
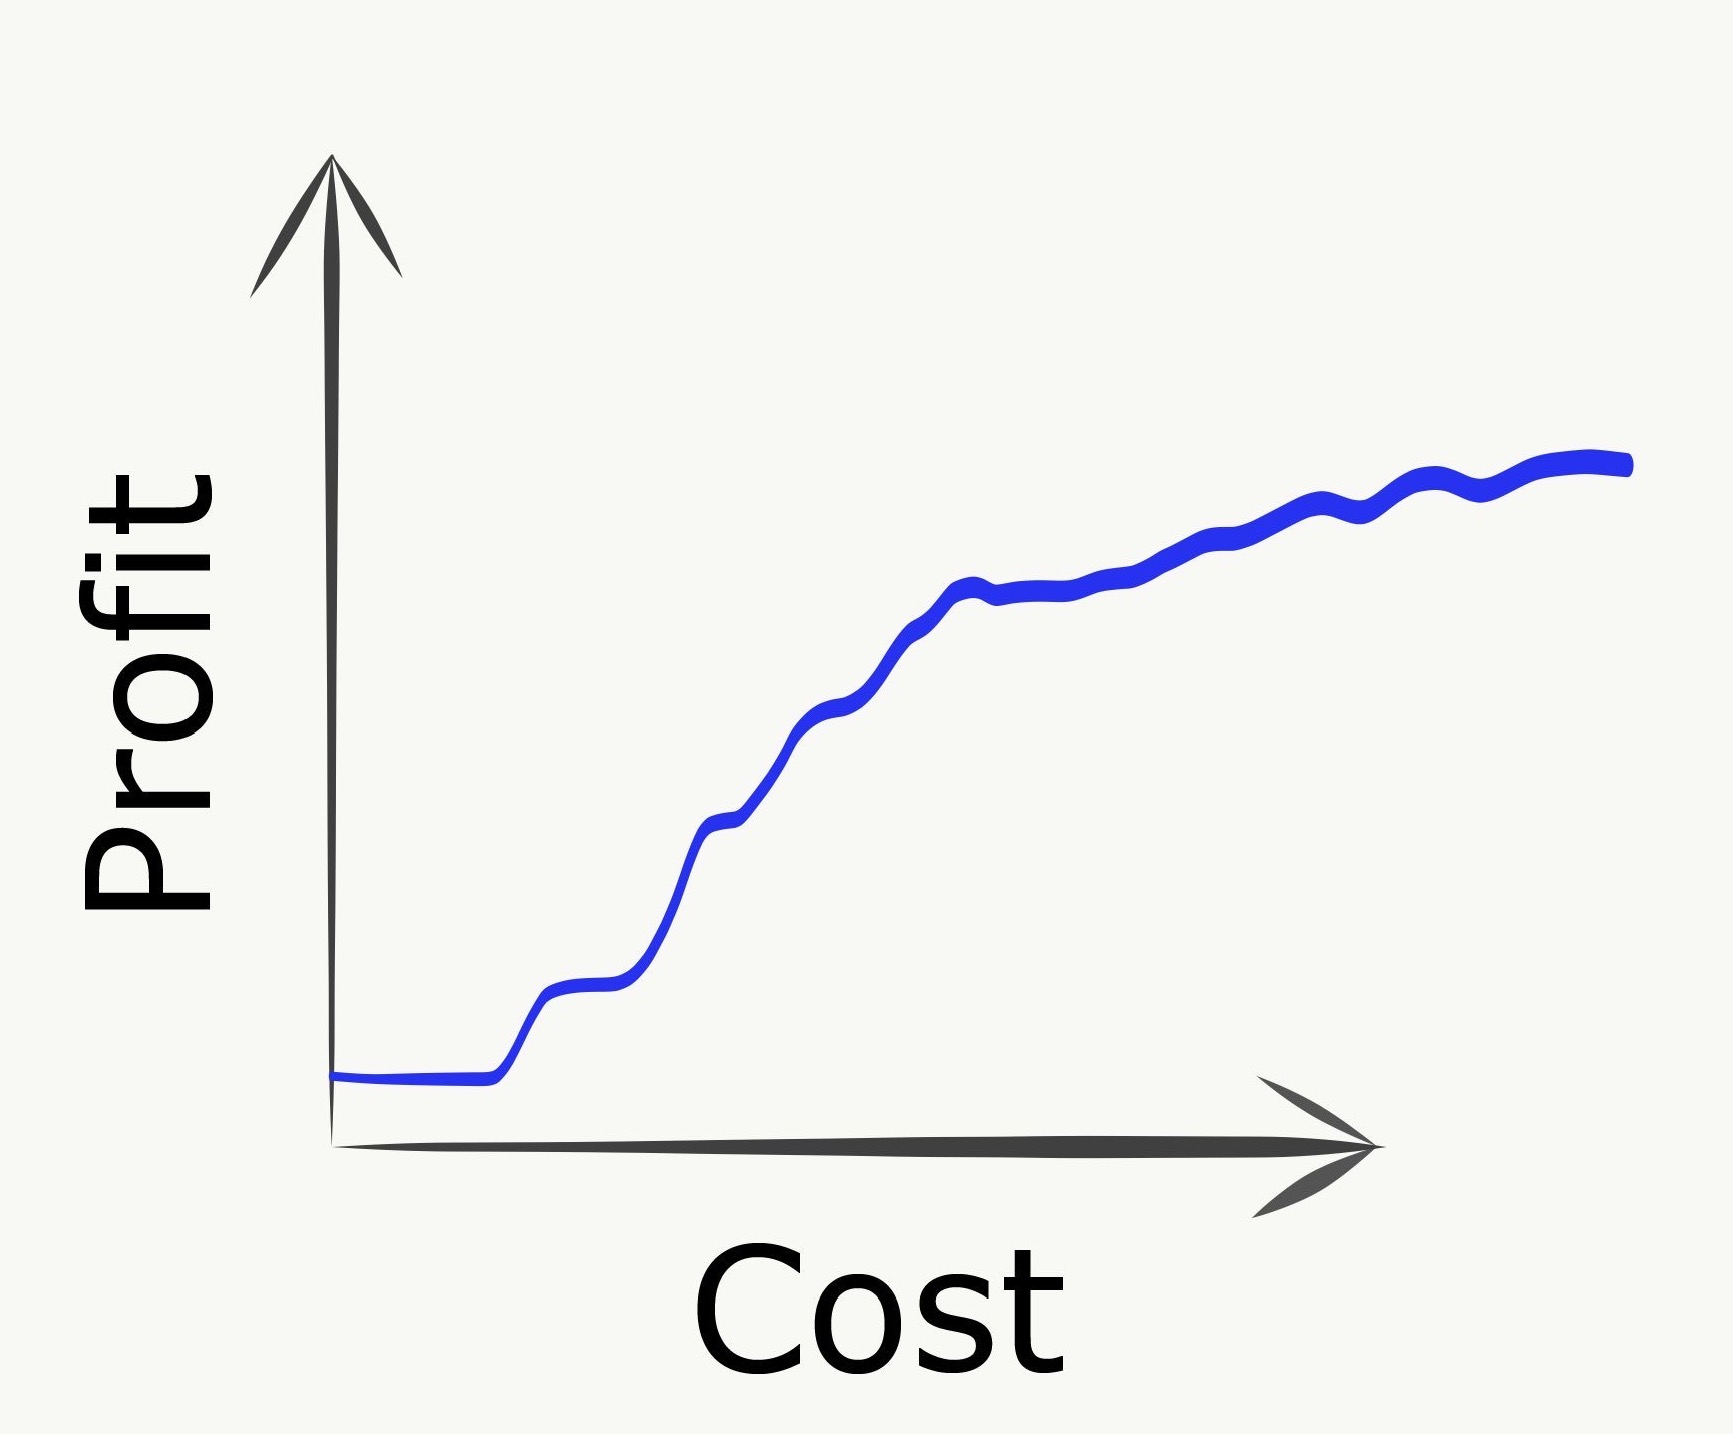
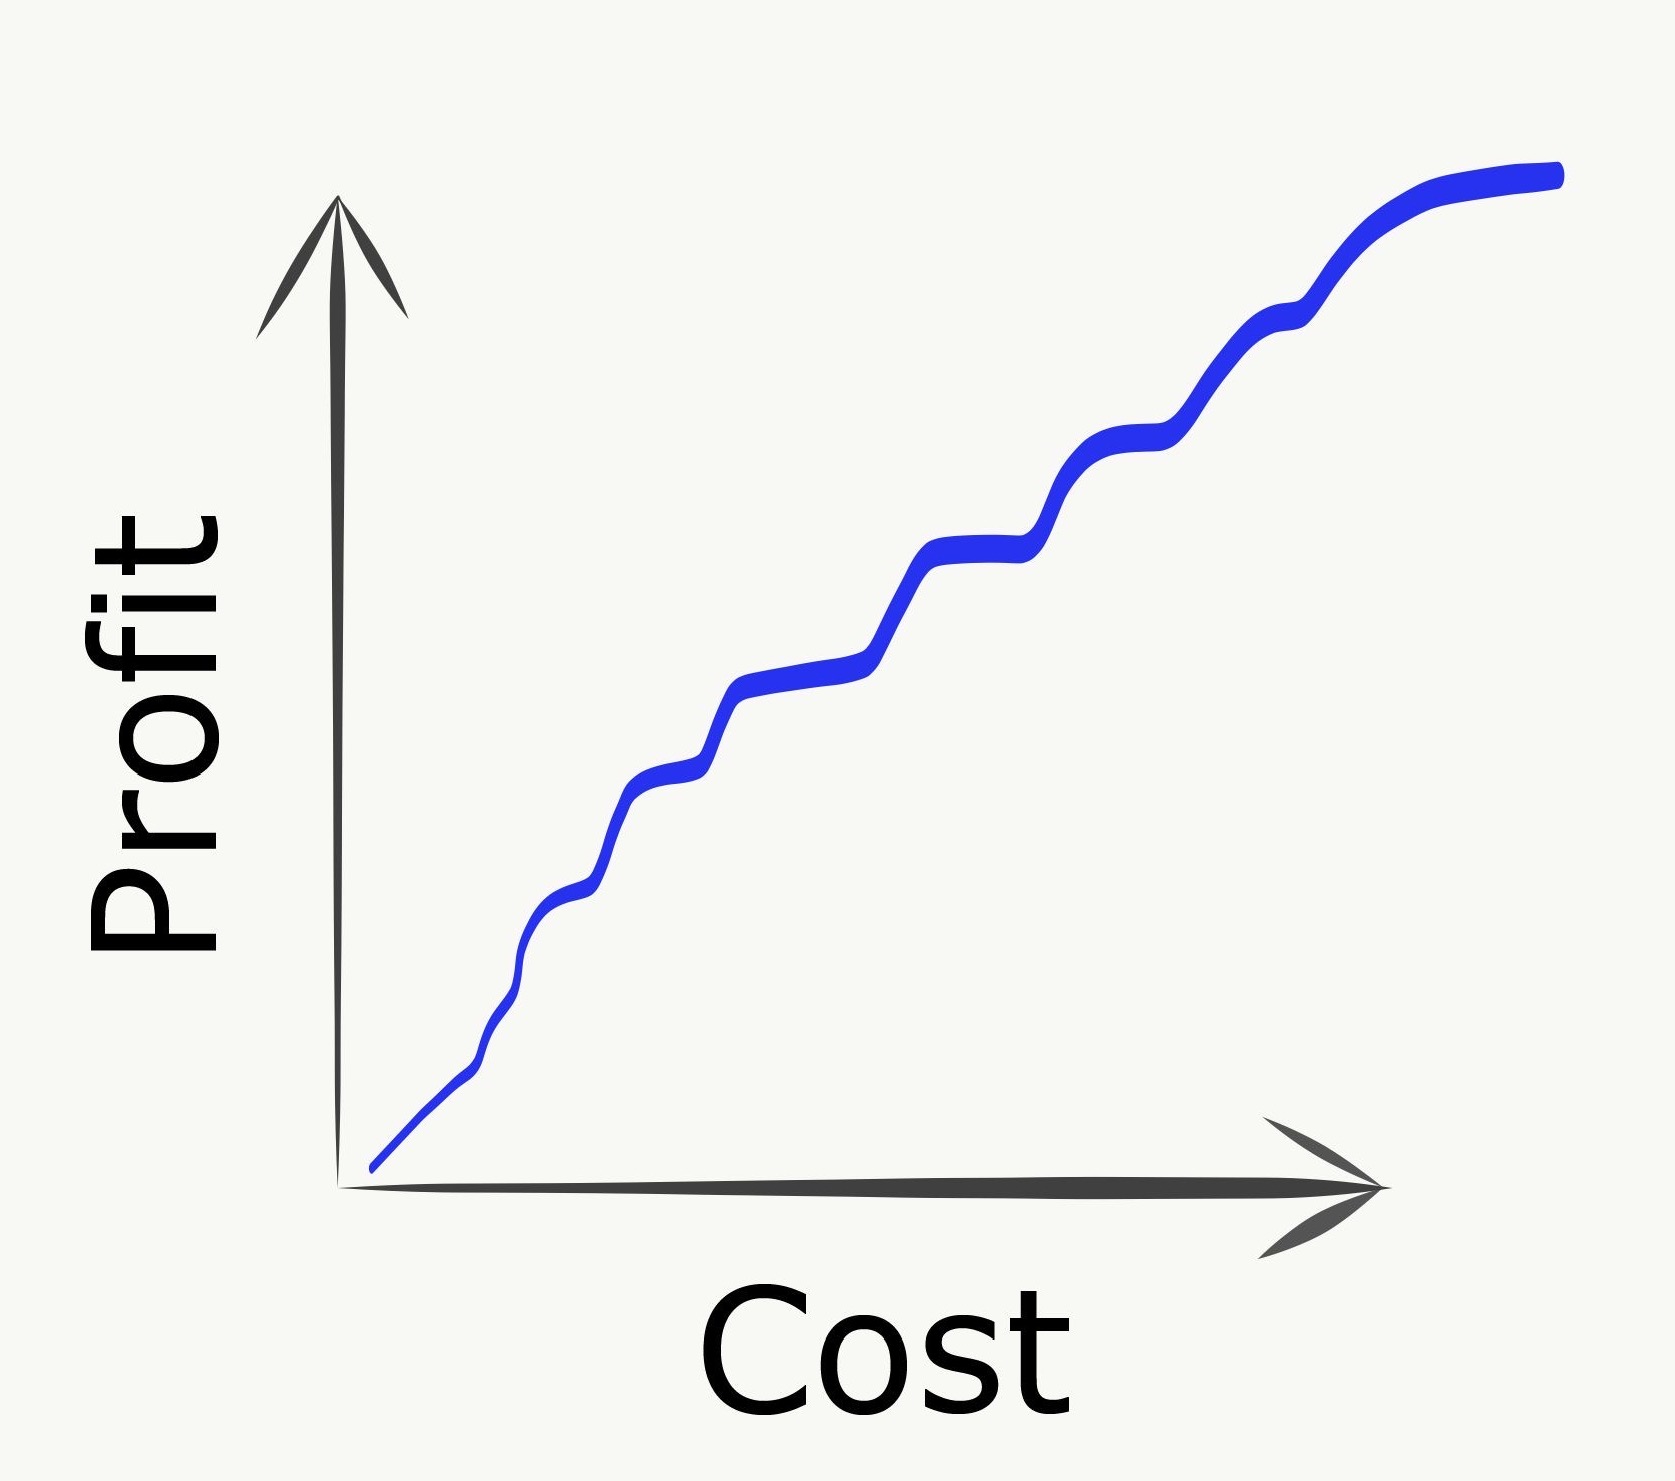
Happy medium
In the idealized case, work is done in such a way to continuously balance the advancement of three purposes:
- deliver immediate value
- unblock subsequent high-value items
- gain new information about the graph
The third item refers to the fact that, in practice, we will not have perfect knowledge of costs or payoffs, so learning new information about these is itself valuable.
If the first two can be well-balanced, the hope is that this approach can navigate between the Scylla of overly-diffuse efforts and the Charybdis of overy-narrow plans to yield a nice and consistent “up and to the right” payoff chart.
Graphs all the way down: PCST for technical architecture
While the motivating examples so far focused on tangible end-user value, we can apply the same ideas to more purely technical tracks of work as well. In this context, the prizes might be de-risking a particularly tricky part of the design, unblocking teammates, or accelerating overall development through improved tooling or infrastructure.
The map is not the territory
Of course this model is not perfect and elides crucial complicating details that make real situations so interesting:
- team capacity is not an undifferentiated mass of abstract “points” - there are different skillsets, working styles, and team dynamics
- goals are not simple binary outcomes, the quality and particulars of what gets delivered matter tremendously
- true costs and benefits are not actually known
- even the graph structure is probably not known
- everything is continuously changing over time, both in terms of the underlying reality as well as our own imperfect knowledge.
As mentioned earlier, in such an environment the “prizes” can take the form of new information itself, such as learning whether the technical design can meet the desired performance requirements or if the target feature satisfactorily solve the customer use case. This added dimension means that the real-life optimization problem more closely resembles messy “explore vs exploit” trade offs than well-understood computational bottlenecks.
Your mileage may vary
Would I recommend literally encoding your plans into this format and dumping them into some solver software to decide your optimal course of action? Probably not. Is it helpful to have this mental model simmering in the background of your consciousness? Perhaps. Can visually sketching out approximations of these graphs help you to communicate and coordinate within and across teams? Please try it and let me know how it goes!
References
The idea of encoding dependencies into graphs is ubiquitous in large-scale project management, but most discussions I had found were more in the context of tracking the execution of some predetermined plan in terms of its inter-task dependencies, eg with Gantt charts. Deciding which areas to pursue at all, and in what order, did not seem to be the focus in quite the same way as described here. Product roadmaps and other visualization tools have some of this flavor, but I could not find much around framing the problem in terms of an objective function. The interplay between optimizing value and acquiring information in sequential decision-making discussed in The Principles of Product Development Flow may be closer to this line of thinking. If you know of other similar resources or writing please do let me know.
PCST is known to be NP-hard, and has been the subject of very interesting research, in particular on Linear Programming (LP) techniques for guaranteed-factor approximation. A nice collection of results for Steiner tree variations can be found here, and some landmark results on this specific problem are:
- Bienstock, Goemans, Simchi-Levi, Williamson: 3-approximation
- Goemans and Williamson: 2-approximation
- Archer, Bateni, Hajiaghayi, Karloff: $(2 - \epsilon)$-approximation